Connecting To The Server To Fetch The WebPage Elements!!....
Brain Energetics & Neuronal Activity by Wiley - this book discusses various brain regions where there is an increase in functional energetic demand have a corresponding increase in glucose metabolism, their metabolic rate for oxygen and their cerebral blood flow. Cerebral energy is seen as depending on the oxidation of glucose. Cerebral blood flow similarly tracks energy consumption.
Energy production usually involves ATP metabolising glucose. Energy consumption is linked to the release of the neurotransmitter glutamate during neuronal firing, and its subsequent recycling by means of glutamine. There is a one-to-one relationship between the flow of neuronal glutamate and glucose oxidation. Thus energy consumption is converted directly in neural signalling.
Most of this energy is used in restoring neuronal ion gradients after an action potential with this effort split fairly evenly between pre and post-synaptic neurons. About 80% of the brain's energy consumption is devoted to neuronal firing with only 20% involved in maintenance activity. Even in the resting but awake state there is a high level of energy consumption as a result of neuronal signalling.
Glucose consumption is higher in grey matter than white matter, is seen to increased in line with spike frequency, and is reduced in anaesthesia. Neural tissues are seen as responding in much the same way as other tissues. The initial firing of neurons merely draws on an energy potential stored in the membrane of the neuron. Na+ and K+ ATPase later restore the ion gradients. This is an enzyme that consumes a molecule of ATP for every three Na+ and every two K+ ions transported. This represents energy used to restore ion gradients. Some energy is also used for neurotransmitter release and reuptake.
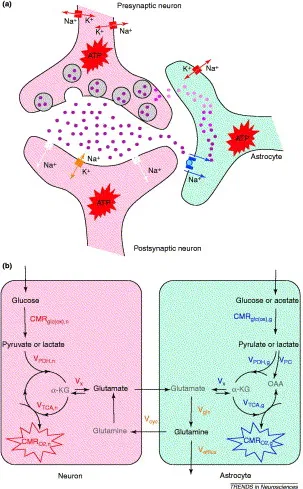
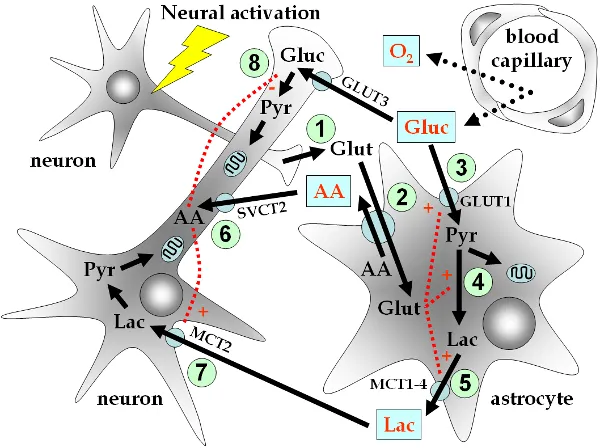
Neuronal activity covers a range of energy requiring processes and particularly restoration of membrane potentials. Neuronal activity and energy metabolism are tightly coupled in the brain. Glucose is the main substrata for energy metabolism. The oxidative steps of a glucose molecule are considered to give rise to 36 out of 38 ATP molecules. Glutamate is the main excitatory neurotransmitter in the mammal brain. Glutamate, GABA neurons and astrocytes are couple by neurotransmitter cycles. Neurotransmitters are rapidly removed from the synaptic clefts. Astrocytes take up most of the glutamate release which convert it into glutamine by a glial enzyme. Glutamine is later taken up by neurons to be converted back into glutamate. Thus there is a glutamate/glutamine cycle between neurons and astrocytes. The energy for neuronal activity comes almost entirely from oxidation of glucose. The brain itself has almost no energy reserves, and therefore needs a continuous vascular supply of glucose and oxygen. The supply is regulated according to the level of the brain's energy demand.
Glutamine neurotransmitters involve a number of energy requiring steps. Glutamate release is triggered by Ca2+ influx into the pre-synaptic terminal, which is pumped out again at a cost in terms of ATP. Glutamate released into the synaptic cleft acts on a number of post-synaptic receptors and also on glial receptors. Activation of these post-synaptic receptors causes movement in ion channels and second messenger cascades. These changes may lead to an ongoing new action potential. ATPase is again necessary to restore ion gradients
The break down of the brain's energy consumption by location in this processing has been estimated as 42% pre-synaptic, 53% post-synaptic and 5% glial. White matter is seen to have a lower metabolic rate than grey matter. Glutamate release and recycling are viewed as the major metabolic pathway in the brain, so measurements of neurotransmitter release may indicate regional brain activity. The glutamate/glutamine flux is significant in resting state brains. Glucose oxidation in glutamergic neurons accounts for 70% of the brain's total energy consumption, with the balance due to atrocytes and GABA neurons.
Neural signalling consumes significant energy and increased activity requires increased energy reflected in increased metabolic rate and blood flow. Much energy goes into the restoration of ion gradients after action potentials. This process is dependent on the hydrolysis of ATP to ADP and most ATP is produced from glucose. Neural energy consumption rises sharply in proportion to spike rate. This also predicts the relation of metabolic rate to turnover of synaptic glutamate.
Neurotransmission proceeds in a thermodynamically downhill fashion as a result of transiently increased permeability for Na+ across the cell membrane. Subsequent restoration of ion gradients is energetically very expensive with ions transported against chemical gradients. The energy is spent keeping neurons reading to do work. Glucose is the main carbon source reacting with oxygen to produce carbon dioxide and water. The metabolic rate of oxygen is 6x the metabolic rate of glucose.
Mitochondria are located where energy is used. In grey matter, they are concentrated around synapses both pre and post synaptic. The large number of pre-synaptic mitochondria are able to deal with both action potentials and synapses. The influx of calcium ions at the synaptic terminals stimulates mitochondria ahead of ion pump demands. If synaptic and action potential signalling is blocked the cytoskeleton accounts for the remaining 50% of energy consumption.
The proportion of metabolic activity devoted to signalling has been estimated by blocking neural transmission with deep anaesthesia, and particularly by blocking the Na/K pump which accounts for most of the energy involved in signalling. This reduces the energy consumption of the whole brain, or at least large regions of the brain, by about 50%. (Astrup et al 1981: Siejo 1978). This would suggest that brain activity was equally divided between signalling and maintenance, but within the cortex the blocking of signalling reduces the metabolic rate by 80-90%. The metabolic demands of grey matter are directly related to its ability to represent events and actions. Metabolic costs rise sharply with frequency and this limits signalling. If 1% of neurons increase their firing rate from 4 Hz to 40 Hz the energy demand of the brain rises by 7.5%.
Neuronal activity and energy are viewed as being decreased by anaesthetics (Hodes et al 1985, Bonvento et al, 1994). PET measurements show glucose metabolism decreasing in anaesthesia, generally on a global basis. With a variety of anaesthetics whole brain activity is shown to fall by between 40% and 55%. (Heinke & Schwarzbauer, 2002) In human brains, the drop in energy consumption is measured at about 50%. Decrease of baseline activity is associated with deepening anaesthesia and eventual loss of consciousness. Numerous studies have shown that cerebral energy metabolism declines in line with reduced levels of consciousness, and the decline was particularly marked in complete unconsciousness. The decrease in baseline activity under anaesthesia is seen as widespread with slow axonal conduction in most neurons. In a study, electrocortical activity was varied by means of different levels of anaesthesia, and neuronal glucose oxidation was seen to change in line with the rate of glutamate/glutamine cycling with a 1:1 symmetry between the two rates.
A study compared changes in oxygen utilisation due to stimulation of a rat's forepaw were compared under light and deep stimulation. The experiment involves the two baseline levels and the two stimulated levels. There were actually three different measurements (1.) stimulation induced increase in activity while under light anaesthesia, (2.) Anaesthesia induced decrease in activity in going from light to deep anaesthesia (3.) Stimulation induced increase in activity while under deep anaesthesia.
Baseline activity is lower in deep than light anaesthesia including a population at very low frequencies. The reduction in baseline activity between light and deep anaesthesia was about 30%. The change in activation is approximately the same as the change in oxygen utilisation. The subject of this experiment was a rat, and particularly the amount of neural activation required to get a response from its forepaw. What the study showed was that approximately the same amount of neural activation was required to get a response from the forepaw regardless of the depth of anaesthesia. But the difference in baseline activity was 30% lower as between light and deep anaesthesia, and presumably closer to 50% as between deep anaesthesia and the waking state. image35This meant that the increment from baseline activity to the level of activity required for response was much greater for deep than light anaesthesia, in fact a doubling of activation compared to only about a 40% increase for light anaesthesia. Signals are seen as requiring particular rates of spiking and oxygen use, and these signals would represent a larger increase from the baseline of deep anaesthesia than from the baseline of light anaesthesia. (Ueki et al, 1988, Hyder et al, 1997) Other studies agree that the deeper the level of anaesthesia the larger the increase in activity required to register a particular stimulus. The size of the activation increase on stimulation is thus seen as an inverse function of the baseline activation.
In the rat experiment, rates of oxidation and glutamate cycling were measured over a wide range of anaesthesia. This showed a relation between neurotransmission and energy levels. For every glucose molecule oxidised, one glutamate molecule is released. Specific neural activity is thus required to perform a task and increments in activity produced by stimulation vary as a function of the starting baseline activity. This is seen to indicate that the important thing is the total level of activity rather than the change in activity. This may also account for apparent rises in activation during anaesthesia.
Unstimulated resting state neuronal activity arising from local and distal neurons is reduced by anaesthesia both inside and outside the somatosensory region involved in the rat experiment. Upon stimulation activity increases locally in the somatosensory cortex, but not elsewhere in the brain. The rest of the brain remains at low activity reflecting the fact that it is not transmitting to the somatosensory cortex. When the forepaw was stimulated during deep anaesthesia, the response was only local, with the rest of the brain remaining at the lower level of activity found in deeper anaesthesia. By contrast, in an unanaesthesised state the forepaw stimulation raises the level of brain activity only slightly. A later study suggests that as the anaesthesia become lighter other parts of the brain start to communicate with the somatosensory area.